Failure Modes and Accelerated Life Modeling of Alloy Resistors under Combined Temperature Cycling and Damp Heat
I. Coupling Mechanisms of Combined Stresses
Driving Force of Temperature Cycling. Due to the mismatch in the coefficient of thermal expansion (CTE) between the resistor body and the terminals, cycling from −55°C to +170°C generates alternating shear stress at the interface. This repeated loading drives the initiation and propagation of fatigue cracks.
Driving Force of Damp Heat. Under 85°C/85% RH conditions, the diffusion and adsorption rates of moisture at the interface and within the protective layer increase significantly, providing an ionic source for electrochemical migration. Furthermore, the hygroscopic expansion of the epoxy molding compound (EMC) imposes additional stress on the interface.
Synergistic Effect. Under temperature cycling alone, the interface remains relatively dry, and crack propagation is dominated by mechanical fatigue. Under damp heat alone, the alternating mechanical load is absent. When combined, the crack tips act as concentrated sites for ion accumulation and electrochemical reactions. Consequently, the damage propagation rate exceeds that of either single-stress condition. This synergistic effect is the core value of combined environmental testing.
II. Typical Failure Modes and Acceptance Criteria
Interfacial Bonding Degradation. Characterized by a unidirectional drift in resistance during cycling that tends to saturate, with post-test resistance changes exceeding the acceptance criteria. Corresponding tests: Temperature Cycling (TEST 4), High-Temperature Storage (TEST 3).
Moisture Absorption and Protective Layer Degradation. Characterized by a continuous upward trend in resistance over time, with the magnitude of change amplified under high-humidity, loaded conditions. Corresponding test: Damp Heat (TEST 7).
Electrochemical Migration. Characterized by a slow drift in resistance after prolonged current loading. The drift rate is significantly higher under damp heat than under dry heat conditions, leading to considerable cumulative long-term drift.
Electromigration and Thermal Stress-Induced Cracking. Characterized by step changes rather than smooth drift in resistance during cycling, corresponding to a reduction in the effective bonded area at the interface.
Appearance and Solder Joint Degradation. Manifested as coating blistering, solder joint cracking, and device warpage. These are extreme manifestations occurring when stress levels exceed the structural integrity of the package and interface.
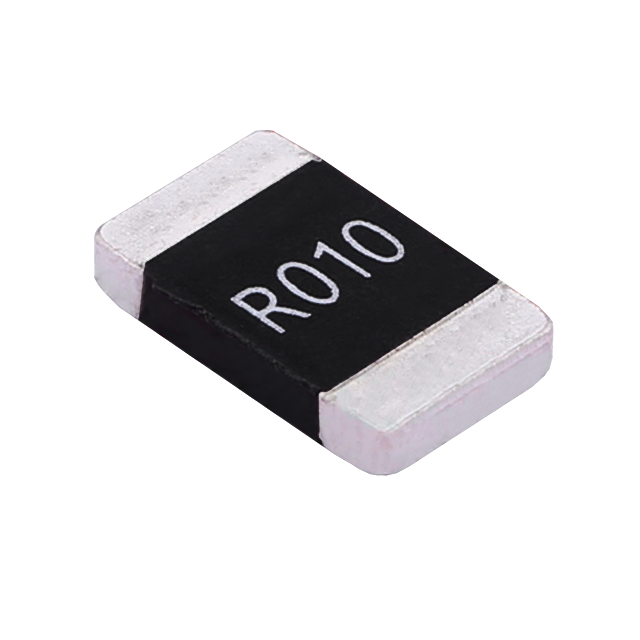
Taking the reliability items in the datasheet of Milliohm's bare alloy resistor 2512 (HoLRS2512, 0.2 mΩ–5 mΩ, 3 W, −55°C to +170°C) as an example, the correlation between each test and its acceptance criteria is as follows:
| Test Item | Test Conditions | Acceptance Criteria |
| Temperature Cycling | 1000 cycles (−55°C to 155°C), 30 min dwell, 15°C/min ramp (TEST 4) | ΔR ≤ ±0.5%, no visual damage |
| High-Temperature Storage | 155°C, 1000 h, no load (TEST 3) | ΔR ≤ ±0.5% |
| Damp Heat | 1000 h, 85°C/85% RH, 10% rated power (TEST 7) | ΔR ≤ ±0.5% |
| Load Life | Rated current, Ta = 125°C, 100% power, 1000 h (TEST 8) | ΔR ≤ ±0.5% |
| Low-Temperature Storage | −55°C, 1000 h (JIS-C-5201-4.23.4) | ΔR ≤ ±0.5% |
| Mechanical Shock / Vibration | 100 g half-sine, 0.5 ms / 10–2000 Hz, 3 axes (TEST 13/14) | ΔR ≤ ±0.5% |
| Short-Time Overload | 5x rated power, 5 s (JIS-C-5201) | ΔR ≤ ±0.5% |
III. Methodology for Constructing Accelerated Life Models
Step 1: Select the Stress Models. Temperature acceleration is described by the Arrhenius relationship and damp heat acceleration by the Peck model. For combined stresses, a multiplicative superposition is applied:
AF = AF_T × AF_H
where AF_T is determined by activation energy (Ea) and stress temperature, and AF_H by the humidity exponent and relative humidity. Initially, typical literature values may serve as priors, which are subsequently refined via regression against measured data.
Step 2: Determine Failure Criteria. Use resistance change (e.g., ΔR/R exceeding 0.5%) as the primary criterion, supplemented by visual inspection. For long-life modeling, a "drift rate" can serve as an equivalent criterion—the time required for the resistance change rate to reach a critical threshold at a given stress level.
Step 3: Design the Stress Profile. Temperature cycling and constant high temperature correspond to distinct failure mechanisms and must be modeled separately. Damp heat tests should incorporate simultaneous electrical stress to cover the electrochemical migration path. Stress levels must maintain a sufficient margin from actual operating conditions to prevent excessively long test cycles. Conversely, they must be clearly distinguished from actual conditions; otherwise, the dominant failure mechanism may shift, rendering the model invalid for extrapolation.
Step 4: Sampling and Statistics. A minimum of 10 samples per stress level is recommended, allocated across time-temperature-humidity-voltage combinations. Failure data are processed using Weibull or log-normal distributions to derive characteristic life and shape parameters. The sample size and number of stress levels dictate the model's confidence level.
Step 5: Model Verification. Use stress levels excluded from the modeling process as verification points to compare predicted versus measured life. The model is only valid for extrapolation if the deviation falls within an acceptable range.
Step 6: Integration with Derating Curves. Life model extrapolation must operate in conjunction with the derating basis. Milliohm employs 70°C as the baseline for rated power across its product lines, defining the power-temperature relationship via the derating curve with linear derating to zero above 70°C. By combining the derating curve with the accelerated life model, the "life under accelerated conditions" is translated into "usable lifespan under actual field conditions."
IV. From Modeling to Selection
1. Determine the test matrix based on the actual operating profile. By providing the field temperature cycling range and frequency, humidity range, power-on state, and operating power, the required test categories can be accurately defined, avoiding the use of a single test to cover all conditions.
2. Verify test conditions and acceptance criteria, not just the conclusions. Identical criteria under different conditions mean life data cannot be directly compared—an often-overlooked aspect in selection reviews.
3. Base selection on combined-condition data. Measured drift data under combined temperature and humidity conditions reflect field performance more accurately than nominal parameters under single-stress conditions.
4. Calculate derating margins based on actual ambient temperatures. Once actual ambient conditions are provided, our FAE team can calculate the usable power based on the derating curve and recommend the optimal package and power rating to ensure sufficient margins.
Conclusion
The value of combined environmental testing lies in advancing products from being "individually qualified" to being "long-term reliable under actual operating conditions." Through the full AEC-Q200 reliability test suite, a unified ΔR ≤ ±0.5% acceptance criterion, and a comprehensive derating curve system, Milliohm provides verifiable quantitative evidence for the long-term field performance of alloy resistors.
For measured data under combined temperature-humidity conditions, accelerated life model parameters, or derating curves for specific models, please contact the Milliohm technical department for official specifications.
Electro-Thermal Coupling Simulation and Structural Optimization of Alloy Shunt Resistors under High-Current Conditions
Impact of Laser Trimming on Resistance Accuracy, Residual Stress, and Stability in Alloy Foil Resistors
Related Article